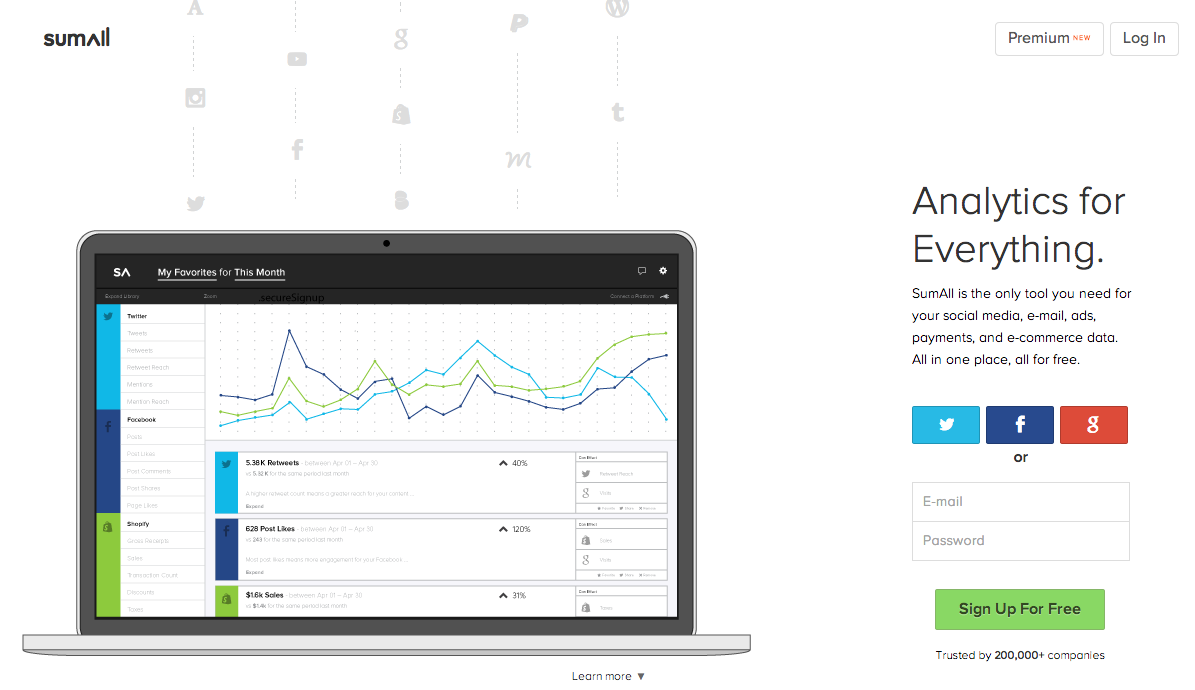
The summary of SumAll:
(see what I did there?)
- It’s an analytics dashboard that doesn’t provide analytics on its own, but instead aggregates data from multiple other places (including Google Analytics, Paypal, Stripe, MailChimp, Twitter, and Facebook, just to cover the basics). This lets you see all your data in one spot.
- There’s a very full-featured free version, or you can pay $9/month for the upgraded version, which includes custom alerts, priority access to new features, and an account manager/expert to help you reach your goals.
- You can use SumAll to set goals, combine metrics, and use the mobile app to view your data, among other things.
Watch the video review to get a breakdown of what it looks like and how you can start to use it for your business.
The main way I use it is to spot patterns. In the video, I match my site hits to my daily number of tweets, and there is a clear and obvious pattern between the two. Of course, it’s always important to remember that correlation is not exactly the same as causation, but you will notice patterns when you look at your data in such an easy to use manner. You can then investigate the patterns further to see what factors are actually causing them, and learn how to leverage those factors to increase the important metrics in your business (namely, money).
You’ll notice a few clear outliers to look into:
One of the days in June that was a clear anomaly, I was tweeting about my post on FastCompany (and one of the summer slump series posts, and the summer of systems bundle, and Instagramming on my trip *cough*). On another major outlier, I had buffered up several posts from others to share and was live-tweeting as I got caught up on Game of Thrones. So, you know, makes sense I wouldn’t necessarily be driving traffic to my site either of those days.
This is an example of why actually drilling down to the data is important, because sometimes the statistics won’t be related. You could happen to have a guest post at a high-traffic site go up the same day you decide to binge-watch Orange is the New Black and tweet about it, and then look at the dash and be like “Obviously I need to tweet 50x/day every day, because damn look at that traffic spike!”
Getting a clear view of the data gives you takeaways that you can use in continuing to build your business.
For example, here’s some of mine:
- There is a clear link between Twitter usage and site traffic. Which means that if I want to keep that link strong and/or increase it, I need to keep sharing my posts on Twitter and probably go out of my way to make sure there are specific tweetable lines in the post (like I did with this one) so that I can share the same post without just tweeting “[headline] [link]” over and over again.
- But at the moment, there isn’t necessarily a link between site traffic and sales. Before I spend a bunch of time working on strengthening the link between Twitter and site traffic, is there something else I can be better spending my time on, like oh say, pitching ideas that are going to lead to more work? Probably so. I could also work on making sure that traffic coming through Twitter converts to email subscribers at a decent rate by tweaking and testing the location of my opt-in boxes and the copy used in them.
I’d really like to be able to see the link between site traffic & email list signups, but I can do that via my other analytics tools. It would be really useful to overlay new email signups onto that same chart, so that I could see if the traffic that came from Twitter actually correlates to more email list sign ups or not.
Some kind of integration with Harvest (the tool I use for time-tracking, using that link gets you $10 off your first month) would be awesome too. That way, I could see if there was actually a correlation between working more or working more on certain tasks & making more money. For example, in the week or month after I log a ton of hours on pitching, do I make more money than the month or week previous? I can track all of this on my own (and I have been), but having it laid out in SumAll’s awesome interface would be great. I’m betting that probably won’t happen because it’s a pretty freelancer/service-based-business specific metric to track, but it’d still be awesome.
That said, SumAll is an incredibly useful tool with a great interface, and you certainly can’t beat the price-tag. I’d recommending signing up and setting up your dash, if nothing else, just so you have usable data to go back to in a month or two down the line.
